A Review of 2018 BIXI Usage in Montreal
A Closer Look at the Data
 @Michel Rathwell
November 15 saw the end of Bixi Season in Montreal. First launched in 2009, the popular bike-sharing system is one of many examples of how urban centers can offer an affordable and convenient public good. The distribution and accessibility of such vehicles cater to tourists and locals alike: the former might find the system less confusing than a bus schedule, while the latter is likely to use the system for summer commuting. Globally, there are an estimated 1,000,000 bike-share bicycles. As an alternative to private, motorized transportation, bike-sharing systems like BIXI offer city dwellers a mode of public transit that not only reduces traffic congestion and pollution, but also contributes to a public health good: coupled with Montreal’s bike infrastructure, increased availability of BIXI translates to an increase in usage, therefore promoting healthy mobility among populations.
2017 was a big year for BIXI. Reports indicate that more than 258,000 people took advantage of more than 4.7 million trips from April to November – a 10% increase in individual users compared to 2016. How does 2018 stack up? For the months of April to October, there were a total of 5.1 million trips taken, already surpassing 2017’s figures. 82.8% of these trips were by subscribing BIXI members. The trend is clear over the past few years: BIXI usage has been going up.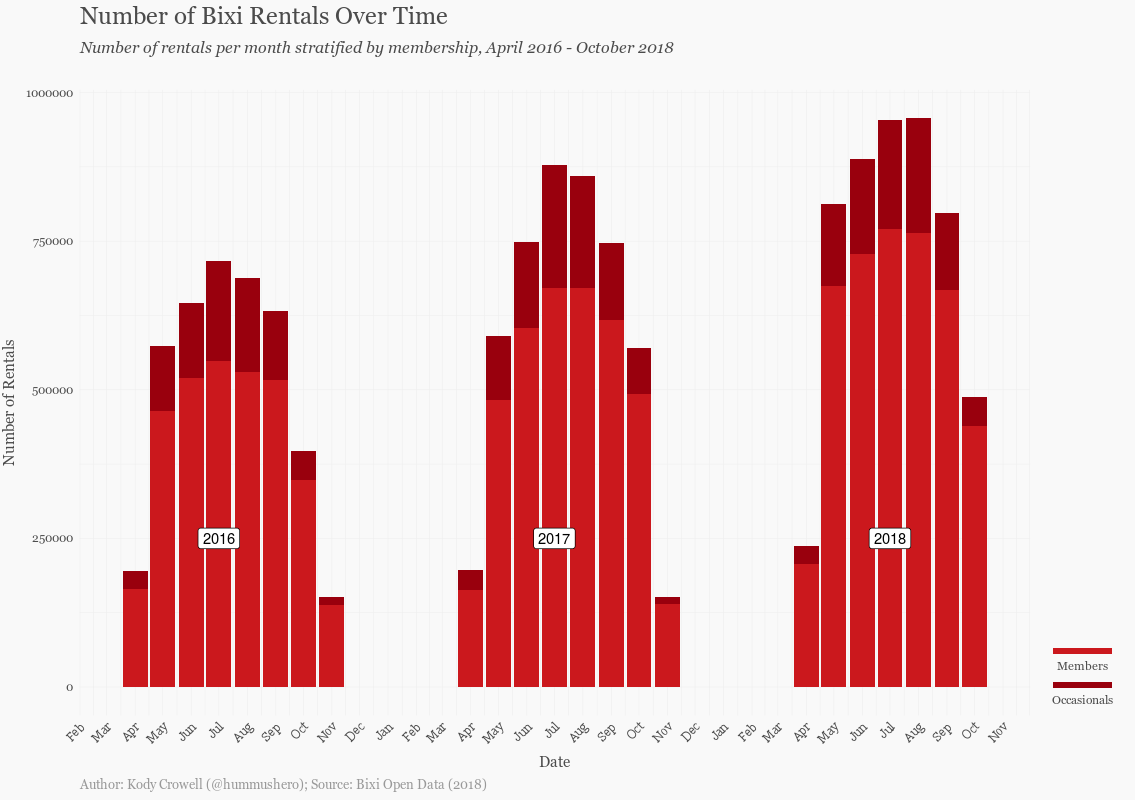
Where do most people rent? Below is a map of BIXI stations around the island of Montreal for 2018. As expected, most users typically rent in the Plateau and downtown, both areas with an ample supply of bike routes.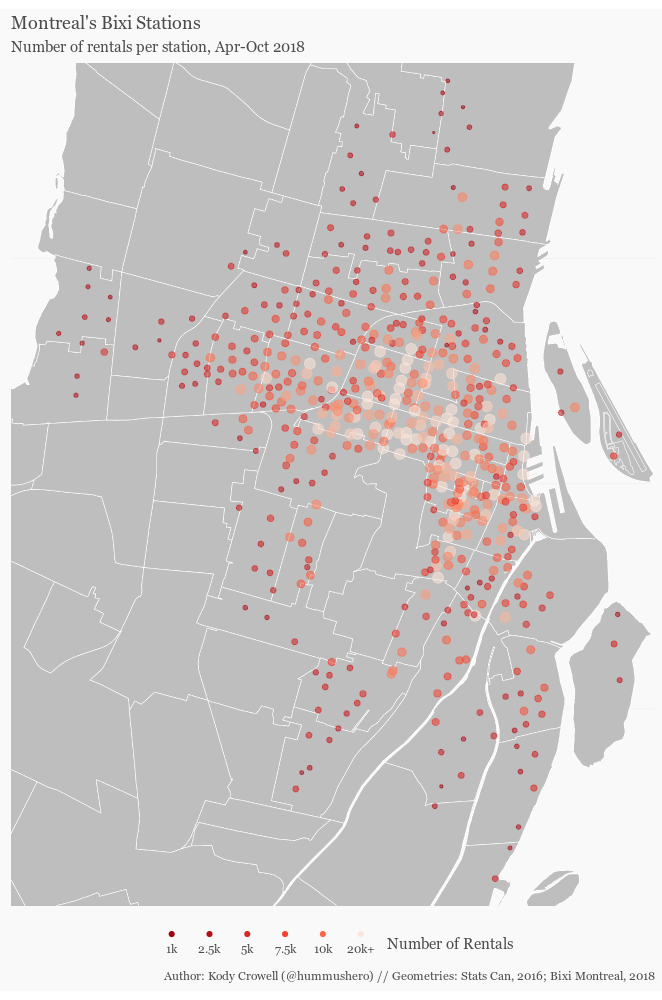
Trips, on average, last around 10 minutes in duration. Indeed, many trips start and stop on the same street as shown below, and the stations most heavily used as origins and destinations are those near metro stations: Laurier, McGill, Pie-IX, Georges-Vanier, Atwater…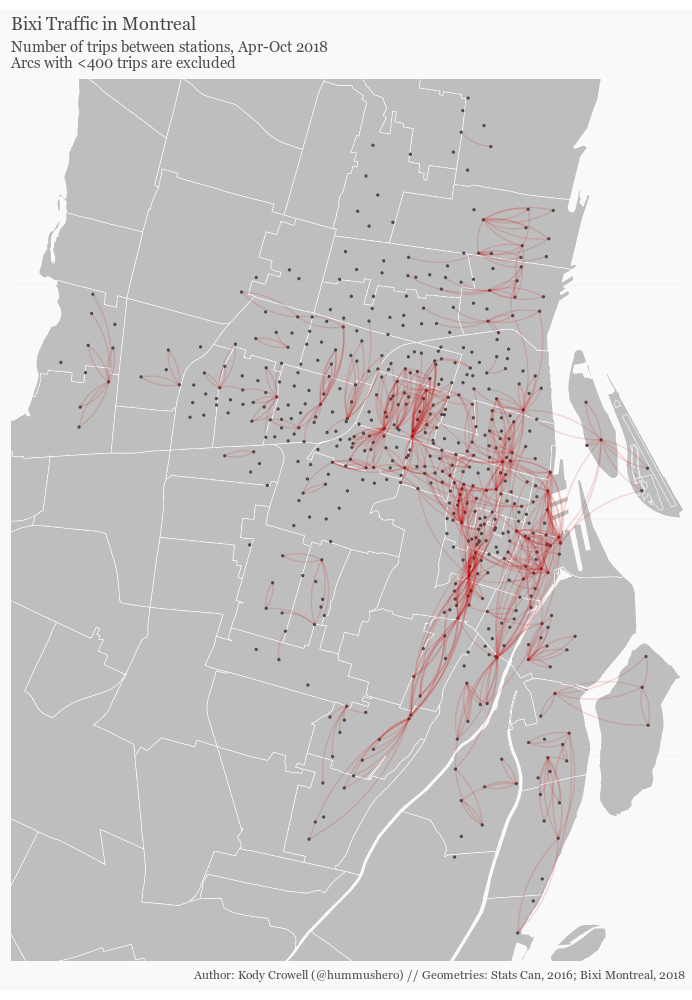 Most of these trips are by regulars. Below, each arc is colored by the proportion of trips that were used by members. The darker the red, the higher the proportion of members. Near Old Port and the canal, non-members seem to use BIXIs more than members – a possible indication of the number of tourists that pass through.
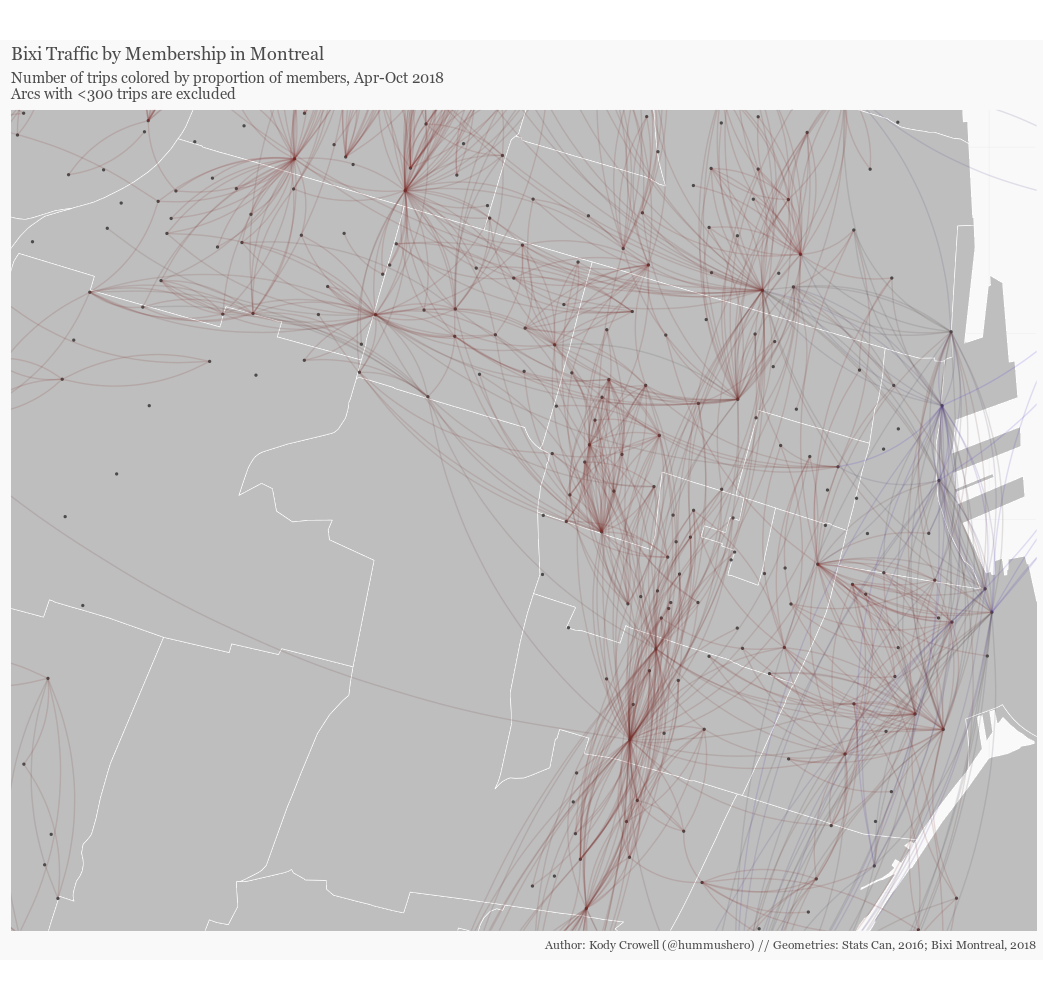 In order to boost the numbers without BIXI membership, one of the initiatives that BIXI Montreal has taken over the past few years are their occasional free Sundays, which have seen an increased uptake in users.
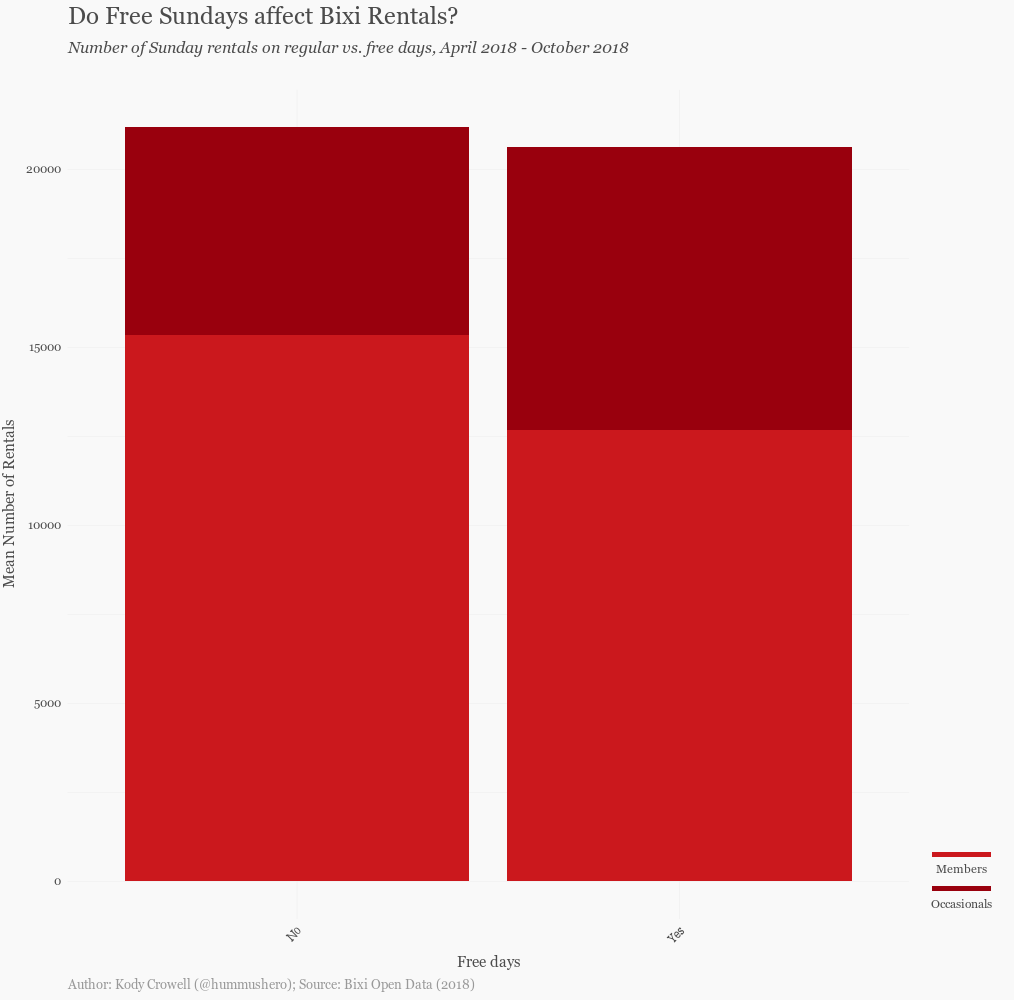 However, most trips don’t occur on the weekends. Plotting the number of trips per minute and stratifying by weekdays and weekends, we see clear spikes in usage at the beginning and end of the workday with no such pattern seen on Saturdays or Sundays.
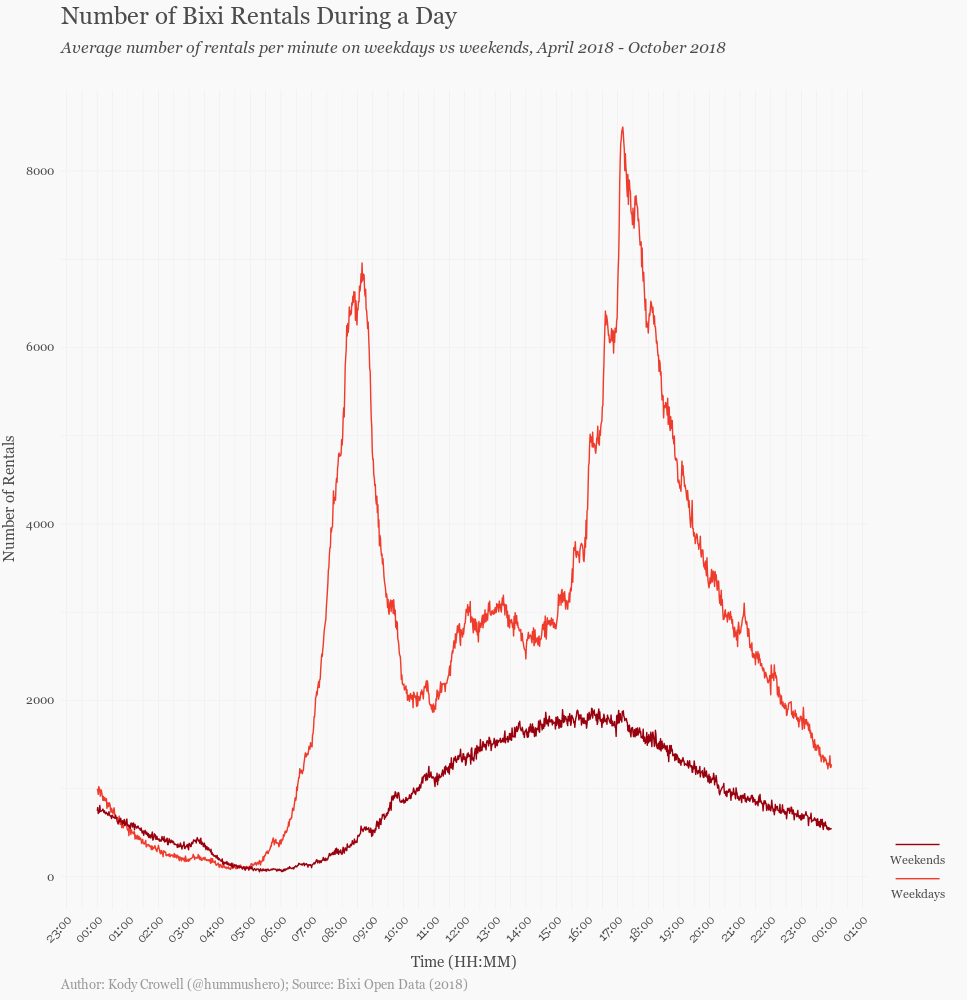
Heavy usage occurs during weekday commuting hours, when congestion is at its worst and the risk of an accident is high, especially considering that most users of public bike-sharing systems don’t wear helmets. Should the city seek to increase uptake, they should continue to invest in cycling infrastructure in more deprived areas and continue to normalize casual cycling as an affordable and convenient mode of transportation.
Feature photo by @Michel Rathwell. For more information on BIXI in Montreal, visit their open data portal. Also, check out Chris McCray’s cool analysis of how weather impacts BIXI traffic in Montreal. All code is available on the author’s GitHub, @eisengrim. For more on health and data, follow the author on Twitter: @hummushero.